Here is some data from a grade 6 class I just finished working with. They were new to robotics. The pre/post survey asked 2 quantitative questions.
Q1 – I like using computers and other technology.
Strongly Agree Agree Neither Agree or Disagree Disagree Strongly Disagree
Q2 – I would consider being engineer when I am older.
Strongly Agree Agree Neither Agree or Disagree Disagree Strongly Disagree
Here are 2 graphs showing the results.
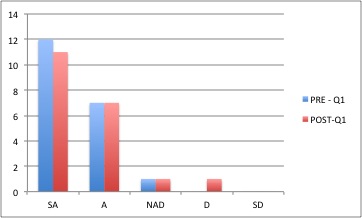
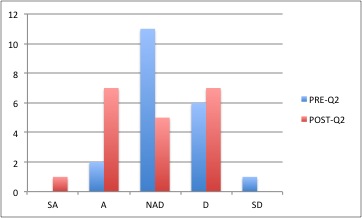
There was not much of an effect for Q1. Students’ views of using technology did not change significantly. Q2 showed a marked positive change in whether or not students would consider a career in engineering. Looking at individuals, some students went the other way too, which I now think is expected as some students find the engineering design process not for them.
I am just learning SPSS so I will post the statistics in the future. The qualitative data was also interesting. I’ll also report on that later as well.
Pingback: Data Analysis And Implications – Grade 6 Survey | Kids Engineer!