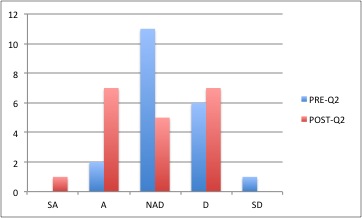
In a previous post ( https://kidsengineer.com/?p=572 ) I showed a graph of sixth grade attitudes towards computers/technology and engineering as a career. This results were pre/post surveys before and after a grade 6 robotics unit. The students had not experienced LEGO robotics before. The graphs seems to show a some significant gains in terms of interest in engineering as a possible career though some students went the other way as well.
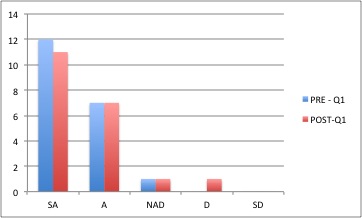
Here’s the graph of question 1.
Q1 – I like using computers and other technology.
Strongly Agree Agree Neither Agree or Disagree Disagree Strongly Disagree
Here is question 2 and the associated graph.
Q2 – I would consider being engineer when I am older.
Strongly Agree Agree Neither Agree or Disagree Disagree Strongly Disagree
Even though it was a small sample, I was anxious to try my hand at data analysis using SPSS, a statistical tool I had not used before. I will report the data on question 2 only since it is clear from the graph that question 1 showed little change.
Paired Samples T-Test
p= .074 (N=19) t=-1.5, one-tailed
p <.05 is usually considered to be statistically significant so, though close, I could not show significance. p<.05 means that there is less than a 5% chance that the effect was due to chance.
I reran the data throwing out one response where the student reported a change in interest (negative, in this case) that was clearly not related to his school experience. In this case, p = .0235, which would be considered significant.
.0235 (N-18) t=-2.1, one-tailed
Note to statisticians, why is t negative if the numbers on my class increased (agree responses were coded higher than disagree responses).
While we can’t conclude much from such a small sample size either way, I do think that this preliminary data shows some significant movement in attitudes (mostly positive). While I first was only looking for positive changes in engineering interest, I now think that is in normal and natural for some kids to find it’s not for them, even though they seem to find the project fun and interesting. I do believe that with a larger sample with a good curriculum and teaching, there would be a statistically significant result from this simple survey. Looking at the qualitative data as well, some interesting questions emerge for evaluating interest in STEM careers at such a young age.
1) What is the best way to measure STEM interest? It is clear from some of the qualitative responses (“Why would you consider or not consider a career in engineering?”), that sixth grade students do not necessarily have a clear idea of what engineering is (despite some teaching of what it is and their experience with the project.) Most moved from thinking about engineering as building initially to designing and building at the end of the project.
2) Some students are not far from the “fantasy” age of career choices such as reporting low incidence possibilities so common in younger children.
3) In talking to kids about this, many give answers not rooted in their actual engineering experience (no matter how limited) but in other external factors.
It seems that a mixed quantitative and qualitative approach is needed to tease out this questions and how elementary and middle school age student think about career choices based on school experiences.


